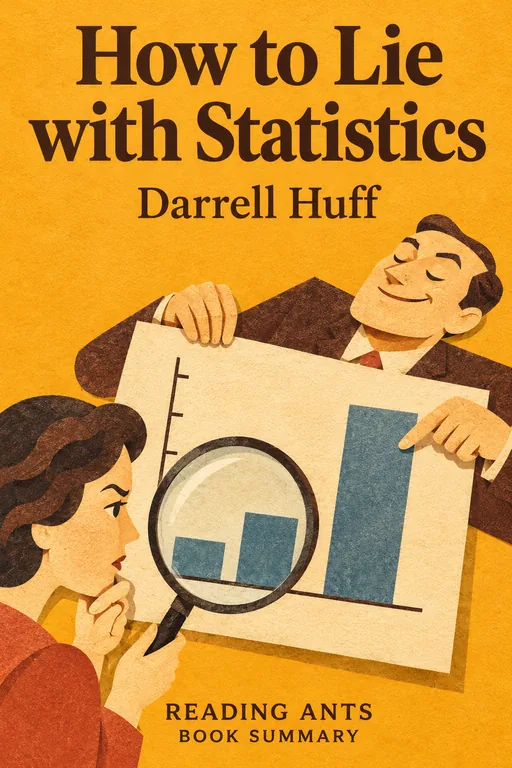
How to Lie with Statistics
Darrell Huff shows, in a light and witty tour of tricks used by advertisers, journalists and others, how numbers, charts and averages can mislead, so that readers can learn to spot the deceit.
Overview
How to Lie with Statistics was published in 1954 by Darrell Huff, a magazine editor and writer, with illustrations by Irving Geis. It is a short book and is often called the most popular book on statistics ever written. Huff was not a statistician by training, and wrote it as a guide to the misuse of numbers in everyday life. He says that the crooks already know these tricks, so the honest must learn them in self-defense. Each chapter covers one kind of trick, with examples drawn from real advertisements, magazines and surveys. Huff collected many of them with the help of professional statisticians. The book has remained popular for decades.
Full Summary
The book has ten short chapters, each named after one trick, plus a brief introduction in which Huff contrasts a careful Gallup poll with a newspaper’s coupon poll on how well readers knew the metric system.
1. The sample with the built-in bias
The idea: Huff begins with the sample, the small group on which a claim is based. His main example is a magazine item that said the average member of Yale’s class of 1924 earned a surprisingly precise and impressive sum. He points out that the figure can only come from the classmates whose addresses were known and who answered a questionnaire, and these were likely to be the more successful and the more willing to boast. He adds the Literary Digest’s failed 1936 election forecast, which drew on a list of telephone owners and magazine subscribers who were richer than the typical voter. A sample is only worth something if every member of the whole group had an equal chance of being picked, and even careful polls fight bias all the time.
In real life: A poll of people who visit a gym will tell you little about the health of the whole town.
2. The well-chosen average
The idea: The word “average” can mean the mean, the median or the mode, and these can give very different pictures. Huff shows a neighborhood whose income looks high or low depending on which average is quoted, and a small firm whose owner’s profit and workers’ pay can be described in a flattering or an unflattering way. He notes that Census Bureau figures are usually clear about which kind of average they use, but that many advertisers and reporters are not. Whenever you see an average, ask: average of what, and who is included?
In real life: One billionaire in a small town can raise the “average” wealth enormously.
3 and 4. The little figures that are not there, and much ado about practically nothing
The idea: Many statistics leave out the figure that would show whether the result means anything. Huff’s example is a toothpaste advertised as giving 23 percent fewer cavities, based on a test group of a dozen people. If a company keeps repeating small tests and files away the disappointing ones, chance will sooner or later hand it an impressive headline. He compares this to tossing a coin ten times and getting eight heads. He also describes a polio vaccine test that was too small to show anything, because very few children would have caught paralytic polio in either group, and explains why a degree of significance, and the range around an average, should be reported.
In real life: A result from ten people may look impressive, but could easily be luck.
The idea, continued: In chapter 4 Huff imagines two children, Peter with an IQ score of 98 and Linda with 101, and shows that such a gap is well within the test’s probable error, so it tells you nothing about which child is brighter. Any figure taken from a sample has a plus-or-minus attached, so results are best thought of as ranges, and comparing figures that differ by only a little is meaningless. He adds that magazine editors, advertisers and cigarette companies have often made much of tiny differences.
In real life: Two brands that differ by one point on a test with a wide margin of error are, for practical purposes, tied.
5 and 6. The gee-whiz graph and the one-dimensional picture
The idea: A line graph with the lower part chopped off, so the vertical axis does not start at zero, makes a small change look dramatic. Huff shows how a ten percent rise in national income can be made to look enormous, and cites real advertisements, including a government payroll chart in which an increase of under four percent appears to be more than four hundred.
In real life: A bar chart that starts at 95 instead of zero makes a tiny change look huge.
The idea, continued: In chapter 6 he turns to pictorial charts, such as moneybags standing for wages. They can deceive when one figure is simply drawn twice as tall as another. The picture then has four times the area, or eight times the volume, so the eye sees a far bigger difference than the numbers show. Huff gives real examples from magazines and an industry advertisement, and jokes that a drawing of more cows may make readers think the cows themselves have grown.
In real life: A pictogram that doubles the height of a coin to show a doubling of sales looks like a quadrupling.
7. The semiattached figure
The idea: If you cannot prove what you want, prove something else and hope nobody notices. Huff’s examples include a claim that a juice extractor gave 26 percent more juice, which turned out to mean more than a hand reamer, a poll on job opportunities whose answers reflected the respondents’ prejudice more than the facts, and a comparison of Navy and civilian death rates that ignored how different the two groups were. He also notes that raw counts such as road deaths mean little without rates, and that a rise in reported cases of a disease may only mean better reporting.
In real life: “More people were hurt on bicycles this year” means little if far more people cycled.
8. Post hoc rides again
The idea: The chapter is about assuming that, because two things go together, one causes the other. Huff opens with a study finding that smokers earned lower college grades than non-smokers, and asks whether low grades might drive students to smoke, or whether some third factor, such as a sociable nature, lies behind both. He sorts correlations into those produced by chance, those where the direction of cause is unclear, and those where neither causes the other, and he is skeptical of claims that college makes you richer or less likely to marry, since the people who go to college differ from those who do not.
In real life: Ice cream sales and drownings both rise in summer, but ice cream does not cause drowning.
9. How to statisticulate
The idea: Huff uses this coined word for the manipulation of statistics, and he argues that errors are rarely random, because they nearly always lean in the same direction. He shows how a shaded map can make federal spending look huge by picking large, thinly populated states, how a foundation’s figure for family income was inflated by multiplying a per-person mean by four, how decimals give a false air of precision, and how percentages based on tiny numbers or a shifting base can mislead.
In real life: A claim to “save 100 percent” mixes up the starting price and the new price.
10. How to talk back to a statistic
The idea: In the last chapter, Huff gives five questions to ask about any statistic: Who says so? How does he know? What is missing? Did somebody change the subject? Does it make sense? He uses a survey by a business newspaper, in which most of the companies asked had not answered, to show how a biased source and a self-selected sample go together, and he shows how a missing comparison, a missing base or a missing cause can empty a figure of meaning. The aim is not to reject statistics but to read them critically and not be fooled by an aura of precision.
In real life: If a company says that “most doctors prefer” a product, ask which doctors and how many.
Why It Matters
How to Lie with Statistics has been a long-time best seller, and a standard introduction to statistical literacy. It has been used in schools and colleges, and read by journalists, business people and general readers, and is cited whenever numbers are misused. Huff’s five questions are still a useful checklist. The book’s relevance has grown in the age of data and online claims, when charts and surveys are everywhere. It has also been criticized for its examples, but its core lessons stand, and it has inspired later books on the same topic.
Key Takeaways
- Check the sample. A biased sample gives a biased result.
- Ask which average. Mean, median and mode can differ.
- Look for what is missing. Sample size and margin of error matter.
- Beware misleading graphs. Axes and pictures can exaggerate.
- Correlation is not causation. Look for other explanations.
What We Can Learn
You can use Huff’s five questions on any statistic you see in the news or in an advertisement. Look at the axes of graphs, and the size and source of samples. Ask what a number leaves out, and whether it is being compared in a fair way. Be wary of dramatic percentages without the base numbers. And teach friends and family to do the same. At the same time, do not become cynical: honest statistics are valuable tools, and the aim is to read them with care.
Criticism and Counterpoints
Some statisticians note that the book is dated and informal, and that it deals with only simple tricks, not the deeper issues of statistical inference. Others point out that Huff himself was later associated with the tobacco industry, in testimony before Congress that attacked the reasoning of the Surgeon General’s 1964 report on smoking and health, and that this irony was noted by critics, since he used his skills to cast doubt on evidence. A few say that the book may lead readers to be overly suspicious of numbers. Still, as an introduction, it remains useful.
Who Should Read It
This book is for everyone who reads news, ads or reports, including students and teenagers. It is short, funny and easy to read. Those who want a deeper course can follow with a modern introduction to statistics.
Want the whole book?
A summary is a taste, not the meal. Here is where to find the full book.
You reached the end 🎉
Nicely done. Mark this one as read, and we will suggest what to read next.
Read this next
The Signal and the Noise
Nate Silver
Statistician and election forecaster Nate Silver explains why most predictions fail, and shows that better forecasting comes from thinking in probabilities, updating with new evidence and being humble about uncertainty.
🔬 Science
Bad Science
Ben Goldacre
Doctor and writer Ben Goldacre exposes how pseudoscience, bad statistics, misleading press stories and the tactics of the pharmaceutical and supplement industries distort what we think we know about health, and teaches readers how to evaluate evidence.
🔬 Science
The Demon-Haunted World
Carl Sagan
Carl Sagan defends science as a candle in the dark against superstition and pseudoscience, and offers a "baloney detection kit" of tools for thinking critically and for testing claims.
🔬 Science
Thinking, Fast and Slow
Daniel Kahneman
Our minds run on two systems, a fast, intuitive one and a slow, careful one, and understanding how the fast system fools us can help us make better decisions about money, risk, work and happiness.
🧩 Mind & Psychology
The Art of Thinking Clearly
Rolf Dobelli
Swiss author Rolf Dobelli collects about a hundred short chapters on common thinking errors, such as confirmation bias, survivorship bias and the sunk-cost fallacy, to help readers make fewer foolish decisions.
🧩 Mind & Psychology
A Brief History of Time
Stephen Hawking
One of the world's greatest physicists explains, with almost no math, what we know about the origin, structure and fate of the universe, from the Big Bang to black holes and the nature of time itself.
🔬 ScienceWant something different?
Pick another topic and we will show you three books to start with.